
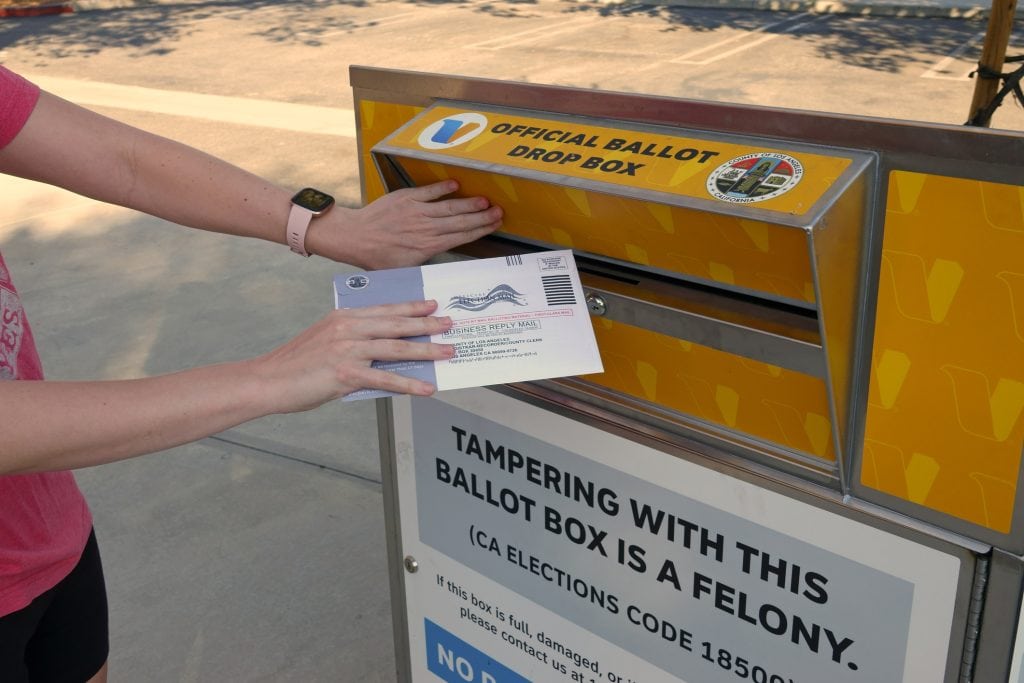
If you own a home in the Beach Cities or on the Palos Verdes Peninsula, or you are looking at one, the question this fall is whether the midterm on Tuesday, November 3 is slowing the market the way a presidential election is said to, on top of a 30-year rate that averaged 7.24 percent this week (Freddie Mac, week ending October 29, 2026) against 6.17 percent a year ago. Here is what the record can and cannot settle. Nationally, contract signings in September fell to the lowest reading in the 25 years the National Association of Realtors has kept the series, below the previous low of October 2023, when the mortgage rate stood higher than it does now. So the rate level alone does not account for the whole slowdown. What else is in it (the speed of September’s rate jump, three years of higher prices, inflation at 3.7 percent, or buyers waiting on the vote) cannot be separated with the data published so far. Locally, our CRMLS pulls show escrows in the beach cities running within a few of last October’s count. The week after November 3 is the first point where an election effect would show up on its own, and this post sets out what that would look like.
What would election-year behavior look like in the data?
The belief runs like this: buyers and sellers do not want to make a large decision while the country is deciding something larger, so showings thin out in October, sales dip into November, and held-back demand comes out after the vote. If that is happening, it leaves two kinds of trace. The first is in surveys, where people say they are waiting. The second is in behavior: contract signings, purchase applications and rate locks that run lower than the rate and the season would produce on their own, and then jump after the vote without a rate move to explain the jump. The second kind is the one that counts, because a survey records an intention and a contract records a decision.
The surveys have caught the intention before. In September 2024, Redfin and Ipsos asked 1,802 homeowners and renters about their plans, and of the 491 who expected to buy their first home within a year, 23 percent said they were waiting until after the presidential election, most of them for a specific reason: a candidate’s down payment plan, a Federal Reserve cut, or a state or local housing measure. First-time buyers were about a quarter of existing-home purchases in 2024 by the National Association of Realtors’ count, so 23 percent of them waiting moves a month’s national sales by a few percent, and the purchases are delayed rather than cancelled. For 2026 we found no published survey that asks buyers whether they are waiting on the midterm. The closest is a Clever Real Estate survey released October 20, 2026, in which 63 percent of Americans said they do not expect the midterms to improve the housing market, 85 percent of likely voters called housing affordability at least somewhat important in choosing a candidate, and 70 percent said housing costs are a bigger issue than in 2024. Clever did not publish its sample size or field dates. Read plainly, the 63 percent cuts against a wait: a buyer who expects nothing to change on November 4 has no reason to hold a decision for it.
What do 35 years of sales data say about election years?
John Burns Research and Consulting compared year-over-year sales in the five months before November across 35 years, election years against the rest. New-home sales fell 10 percent on average in election years and 14 percent in non-election years. Existing-home sales fell 19 percent in election years and 22 percent in the others. Sales fall into November every year because autumn is slower than spring; the ballot did not deepen the dip. The years that broke the pattern, 2000 and 2008, were recession years. The firm’s survey work found 8 percent of consumers deferring a purchase because of the election, a figure the researchers called a likely overstatement, since people who defer for political reasons say so and people who buy because of a job, a baby or a divorce do not mention the calendar. The HousingWire write-up of August 1, 2024 does not say whether Burns counted midterm years among its election years, so the 19 and 22 percent figures are a presidential-year baseline until the firm says otherwise.
The table below puts the last five federal election years side by side: where the 30-year rate stood the week after the vote, where it stood the following March, and what sales did that year and the next.
| Election | Kind | 30-year rate, first survey after the vote | 30-year rate, late March after | Existing-home sales, election year | Existing-home sales, year after |
|---|---|---|---|---|---|
| November 8, 2016 | Presidential | 3.57 percent (November 10, 2016) | 4.14 percent (March 30, 2017) | 5.45 million | 5.51 million |
| November 6, 2018 | Midterm | 4.94 percent (November 8, 2018), the high of the cycle | 4.06 percent (March 28, 2019) | 5.34 million | 5.34 million |
| November 3, 2020 | Presidential | 2.78 percent (November 5, 2020) | 3.17 percent (March 25, 2021) | 5.64 million | 6.12 million |
| November 8, 2022 | Midterm | 7.08 percent (November 10, 2022), the high of the cycle | 6.32 percent (March 30, 2023) | 5.03 million | 4.09 million |
| November 5, 2024 | Presidential | 6.79 percent (November 7, 2024) | 6.65 percent (March 27, 2025) | 4.06 million | 4.06 million |
In every row the year after the vote followed the rate, not the result. In 2018 the rate peaked the week after the vote and fell nearly a point by spring because the Fed stopped raising; sales held flat. In 2022 the rate also peaked the week after the vote, at 7.08 percent, and 2023 became the slowest sales year since 1995 because the Fed kept raising and the rate never came back down. The pattern that matters for this fall is in the two midterm rows: both of the last two midterms arrived in the same month as a rate peak. So did this one, at 7.40 percent on October 8, 2026, the highest Freddie Mac reading since November 2023. Three midterms in a row with a rate climb into the vote means the midterm “temperament,” if it exists, has never been observed on its own in this decade. There is no clean midterm to measure this one against, so the numbers below are considered with that in mind.
Is September 2026 slower than the rate alone has produced before?
Yes, by one measure, and this is the finding worth examining. The National Association of Realtors’ Pending Home Sales Index, released October 20, 2026, came in at 66.0 for September, down 7.3 percent from August and 11.3 percent from September 2025, the lowest reading since the series began in 2001. The West fell hardest, 9.2 percent for the month and 15.0 percent for the year. The previous record low was October 2023, at 71.4, and in the last week of October 2023 the 30-year rate stood at 7.79 percent, the highest of that cycle. September 2026 signed 7.6 percent fewer contracts than October 2023 at a rate that peaked about four tenths of a point lower. A rate that is not as high as it was then, with fewer contracts than there were then, leaves a residual the rate level does not cover.
Four things could be filling it, and the published data cannot yet tell them apart. The speed of the move: Mortgage News Daily’s 30-year rate went from about 6.8 percent at the start of September to 7.6 percent at its end, eight tenths of a point in one month, and a buyer whose approval was written in August faced about $810 a month more on a $1,500,000 loan by the first open house of October. Prices: the national median was $417,500 in September 2026 against $391,800 in October 2023, so the same rate buys less. Wear: the buyers who could stretch to 7.79 percent in 2023 already did, and the pool that remains is more rate-sensitive, which is what Lawrence Yun, NAR’s chief economist, meant by “Buyers and sellers may simply be holding back until mortgage rates move favorably.” And the election, which no 2026 survey has measured and which the index cannot see. Any share of the residual belonging to the ballot would be, on 2024’s survey evidence, a few percent of a month’s signings, and September’s shortfall against 2023 is larger than that. The ballot could be part of it; it cannot be most of it.
The behavior test cuts the other way. If buyers were holding for November 3, a small rate dip in late October would not move them. It did. The Mortgage Bankers Association reported purchase applications up 4 percent in the week ending October 23, 2026 as its 30-year rate slipped from 7.41 to 7.37 percent, and Logan Mohtashami of HousingWire recorded the first weekly rise in pending contracts after weeks of declines as rates eased toward 7.30 percent, with weekly pendings at 52,490 against 67,752 the same week of 2025, inventory at 911,956, up 5.68 percent year over year, and 43 percent of listings carrying a price cut against 42 percent a year ago. Purchase applications were still 18 percent below the same week of 2025. A market that answers a four-basis-point rate move within a week is a market pricing a mortgage, not a ballot.
Why do the election and the rate arrive together?
Because the one documented election effect in housing runs through the bond market and the Fed, not through buyers. A mortgage rate is the 10-year Treasury yield plus a spread lenders add for risk and prepayment; demand follows the rate with a lag of a few weeks; inventory and price cuts follow demand. The bond market prices the fiscal and trade expectations of whoever may win, and the Fed reads the same calendar everyone else does. This cycle shows the second effect in the open. Going into Wednesday’s meeting, futures markets priced a 90 percent chance of no change and a 73 percent chance of a hike at the December 9 meeting, and analysts quoted by Kiplinger expected the Fed to avoid a rate headline the week before the vote. The Fed held at 3.75 to 4.00 percent on October 28 on a 10 to 2 vote, with Governor Lisa Cook and Cleveland Fed President Beth Hammack preferring a quarter-point increase, and the statement said inflation remains elevated. Chair Kevin Warsh said politics played no role in the decision. By Thursday, futures put the chance of a December hike near 85 percent, and the 10-year yield closed above 5 percent on the day of the decision. A buyer who reads “hold now, hike in December” and waits is waiting on the Fed’s calendar, and the Fed’s calendar has the election on it.
What happened after the last two midterms?
Nothing that looked like released demand. After November 6, 2018, the pending index fell 0.7 percent in November to 101.4 and 2.2 percent more in December to 99.0, the lowest since 2014, even though the rate had peaked at 4.94 percent on November 8 and was falling. Contracts turned up in January 2019, two months after the vote and about half a point of rate later. After November 8, 2022, the index fell 4.0 percent in November to 73.9, the second-lowest reading on record at the time, then rose 2.5 percent in December to 76.9 as the rate fell from 7.08 percent to about 6.3 percent on a cooler inflation print. In neither year did signings jump in the week after the vote. In both years they moved when the rate did.
The presidential year of 2024 is the one case of a visible post-vote bounce. In the four days after November 5, Redfin’s Homebuyer Demand Index rose more than 15 percent, and purchase locks more than doubled from a month earlier by November 12, per Optimal Blue. Redfin’s Chen Zhao said buyers had been waiting for two things, the election and a second Fed cut, and both arrived the same week, which is why that bounce cannot be credited to the vote alone. It faded when the 30-year rate climbed back through 7 percent by mid-January 2025.
What does the South Bay show since the September 16 hike?
Our own CRMLS Matrix pulls show a market that slowed when the rate rose and has run level through the campaign. Over the twelve months to September 30, 2026, detached homes in the Beach Cities went into escrow in a median 18 days at 98.7 percent of original asking, and on the Peninsula in 26 days at 96.9 percent, with 1.6 and 2.5 months of inventory on the October 19 count; 96.9 percent works out to about $31,000 under asking for every $1 million. In Manhattan Beach, Hermosa Beach and El Segundo, the beach cities closest to Hawthorne (all property types), 21 homes went into escrow in the twenty days to October 25 against 23 in the same twenty days of 2025, a difference of two contracts, inside one week’s noise, while the number for sale rose from 67 on October 2 to 78 on October 26 and new listings ran 32 against 26 a year earlier. Active detached listings on October 26 stood at 94 in the Beach Cities and 147 on the Peninsula, up from 86 and 142 a week earlier. Set beside the West’s 15 percent year-over-year drop in signings, a two-contract difference on the beach is the smaller move. If there is an election pause here, it is not visible at the size of our weekly counts, and sellers are listing slightly more, not less. The rate is visible: on a $1,500,000 loan, 6.17 to 7.24 percent is $10,222 a month in principal and interest against $9,158, about $1,065 more every month for the same house; on a $1,000,000 loan it is about $710 more.
What is on the South Bay ballot itself is covered in our posts on the local measures and the statewide propositions. Both explain what each measure does and how it touches local real estate.
What would settle it, and when?
The week of November 4 to 10. There is no Fed meeting until December 9, five weeks after the vote. In 2018 and 2024 the Fed met in election week, and in 2022 it raised rates six days before the vote, so this is the first of the four where a move in signings and locks after the ballot would have no Fed decision beside it to share the credit. Three series will show it. Redfin’s Homebuyer Demand Index, published weekly; Optimal Blue’s purchase lock counts, which caught the 2024 bounce; and Mohtashami’s weekly pending contracts in HousingWire. If those rise by a measurable amount in the week after the vote while Freddie Mac’s November 5 and November 12 surveys hold near 7.2 percent, that is the first clean trace of a midterm election effect on buyers in the modern record. If they stay where the rate has them, as they did after 2018 and 2022, then September’s record-low signings were a rate story with three years of prices behind it, and the election was the month it happened in. Either answer is worth having, and the data to get it arrive in about two weeks.
What this looks like if you own, and if you are buying
If you own here, a listing in November meets fewer competing listings than one in May, as it does every year, and it meets buyers whose monthly budget is set by a rate near 7.24 percent. In our experience, sellers who price to the buyer who is in the market this week do better in a fall market than sellers who price to a buyer they expect after the vote, because the post-vote buyer has shown up in only one of the last five cycles, and that time a Fed cut came with him.
If you are buying, the thinner November field is seasonal and arrives with or without an election. The date on the calendar that has moved this market three times this fall is a rate date: September 16, October 28, and next December 9. Having sold through every market cycle since 1984, we have been there: a buyer with a rate locked and a house chosen before December 9 is in a stronger position than one who waits for November 3 and then has to wait for the Fed.
What we report next
The November 10 market report, on our Monday, November 9 CRMLS pull, will carry the twelve months to October 31 and the first post-election week of escrows in the Beach Cities and on the Peninsula, set beside Redfin’s, Optimal Blue’s and HousingWire’s national series for the same week. The Fed’s December 9 decision and Freddie Mac’s survey the following Thursday come in the December 8 report’s follow-up.
This post is a study of market data against current economic data. It is not real estate, tax, lending, financial or investment advice and not a recommendation to buy, sell, hold, list or price any property. Elections, Federal Reserve decisions and ballot measures appear here as dates and facts; we take no position on any candidate or measure. Stats presented here represent the city or area as a whole, not any one individual property.
Sources
Read October 27 to 29, 2026: Mortgage Professional America, “Pending home sales hit record low,” October 20, 2026, reporting the National Association of Realtors’ September 2026 Pending Home Sales Index; Calculated Risk, NAR Pending Home Sales Index, October 2023 (71.4), November 30, 2023; Calculated Risk, November 2018 (101.4), December 28, 2018; Calculated Risk, November 2022 (73.9), December 28, 2022; NAR release via Floor Daily, September 2022 (79.5), October 28, 2022; Calculated Risk, September 2018 (104.6), October 25, 2018; Jeff Andrews, “Political uncertainty has no historical impact on home sales: John Burns,” HousingWire, August 1, 2024; Seattle King County REALTORS, “Home sales unaffected by presidential elections,” September 24, 2024; Mark Worley, Redfin, October 15, 2024; Dana Anderson, Redfin, November 14, 2024; Clever Real Estate via PR Newswire, October 20, 2026; Logan Mohtashami, “Slightly lower mortgage rates finally pause slide in housing demand,” HousingWire, October 24, 2026; HousingWire, “Mortgage applications rebound 3.4% as rates decrease to 7.37%,” October 28, 2026, reporting the Mortgage Bankers Association weekly survey for the week ending October 23; Giulia Carbonaro, Newsweek, October 29, 2026, for the Mortgage News Daily September range and Joel Berner’s and Lawrence Yun’s comments; National Association of Realtors, Existing-Home Sales, September 2026, released October 13, 2026; Freddie Mac Primary Mortgage Market Survey, weeks ending October 8, October 22 and October 29, 2026, and its weekly archive for 2016 through 2025; Federal Reserve, FOMC statement, October 28, 2026; Yahoo Finance live coverage of the October 28 decision, updated October 29, 2026; Kiplinger, Fed meeting commentary, October 27, 2026; National Association of Realtors, annual existing-home sales. Local figures: our CRMLS Matrix pulls of October 6, October 19 and October 26, 2026, single family detached unless stated, Beach Cities (Manhattan Beach, Hermosa Beach, Redondo Beach) and the Palos Verdes Peninsula (Palos Verdes Estates, Rancho Palos Verdes, Rolling Hills Estates, Rolling Hills and the unincorporated Peninsula).


